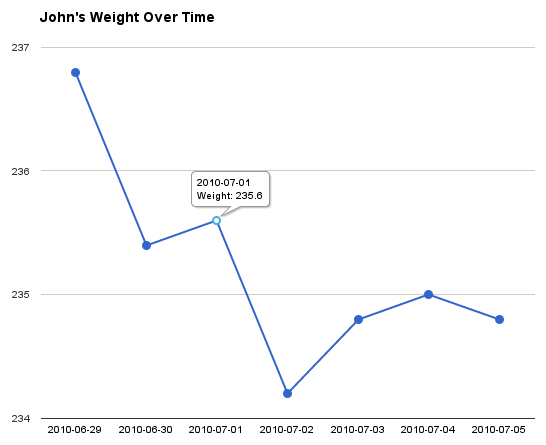
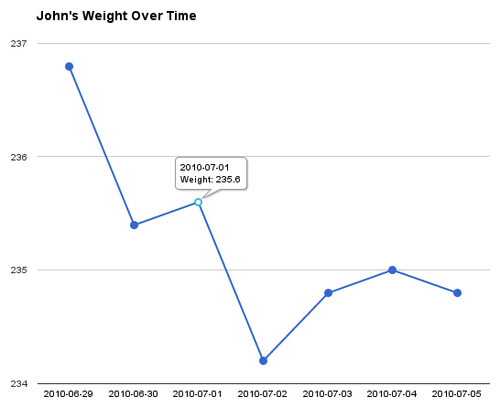
Charting Weight Change With Google Visualizations
I started trying to lose weight a while back, since we both know I'm a bit heavy and sitting in front of a computer isn't going to lose the weight for me.
Naturally, it's important that I incorporate technology into my weight loss somehow, right? So I decided to give the Google Visualizations API a spin.
I worked up a quick data format and a method to pop the data out. Nothing fancy, just a fixed width flat file. This doesn't deserve a database.
2010-06-30 235.4
2010-06-29 236.8
Easy to read, easy to edit, and easy to consume. Every morning I just hop on the server, add the day's weight and log off.
Now I just needed to represent it. The API is very object oriented and easy to work with. I wish there was a less verbose way of presenting the data, but you can't have everything.
Actually, there may be a better way, I just didn't come across it while speed reading the docs.
function drawChart() {
var data = new google.visualization.DataTable();
data.addColumn( 'string', 'Date' );
data.addColumn( 'number', 'Weight' );
data.addRows( );
data.setValue(
,
0,
''
);
data.setValue(
,
1,
);
var chart_div = document.getElementById( 'chart_div' );
var chart = new google.visualization.LineChart( chart_div );
chart.draw(
data,
{
width: 800,
height: 600,
title: 'Weight Over Time'
}
);
}
And there you have it, fancy charting in no time.
See it in action at http://static.velvetcache.org/weight.php
Get the full source at http://gist.github.com/459148.