Building Pandemonium
![]()
Every year, What Cheer creates something fun for Big Omaha.
Previous years have been very interactive, requiring direct participation. A seek and find game, a conference only chat tool, etc. These have been fun, but interaction with the project is sporadic and not ubiquitous. This year we decided to build something that everyone would participate in, simply by being in the audience. Alex had the excellent idea of tracking the loudness of the auditorium over time, and we decided to monitor Twitter as well.
Hardware
To measure sound levels in the auditorium (hangar? main stage?) we would obviously need some hardware on site. We chose a Raspberry Pi for simplicity, and because we already understood it. I initially experimented with using an electret microphone and GPIO, but as time ran out I went simpler and ordered a USB audio interface to plug in.
Before the event Paul and I went to KANEKO to set things up. The helpful guy from binary.net who was setting up the network gave us a hard line so we wouldn't have to deal with wifi traffic, we ran the mic up the wall, plugged it in and watched the data flow. Pretty smooth install.
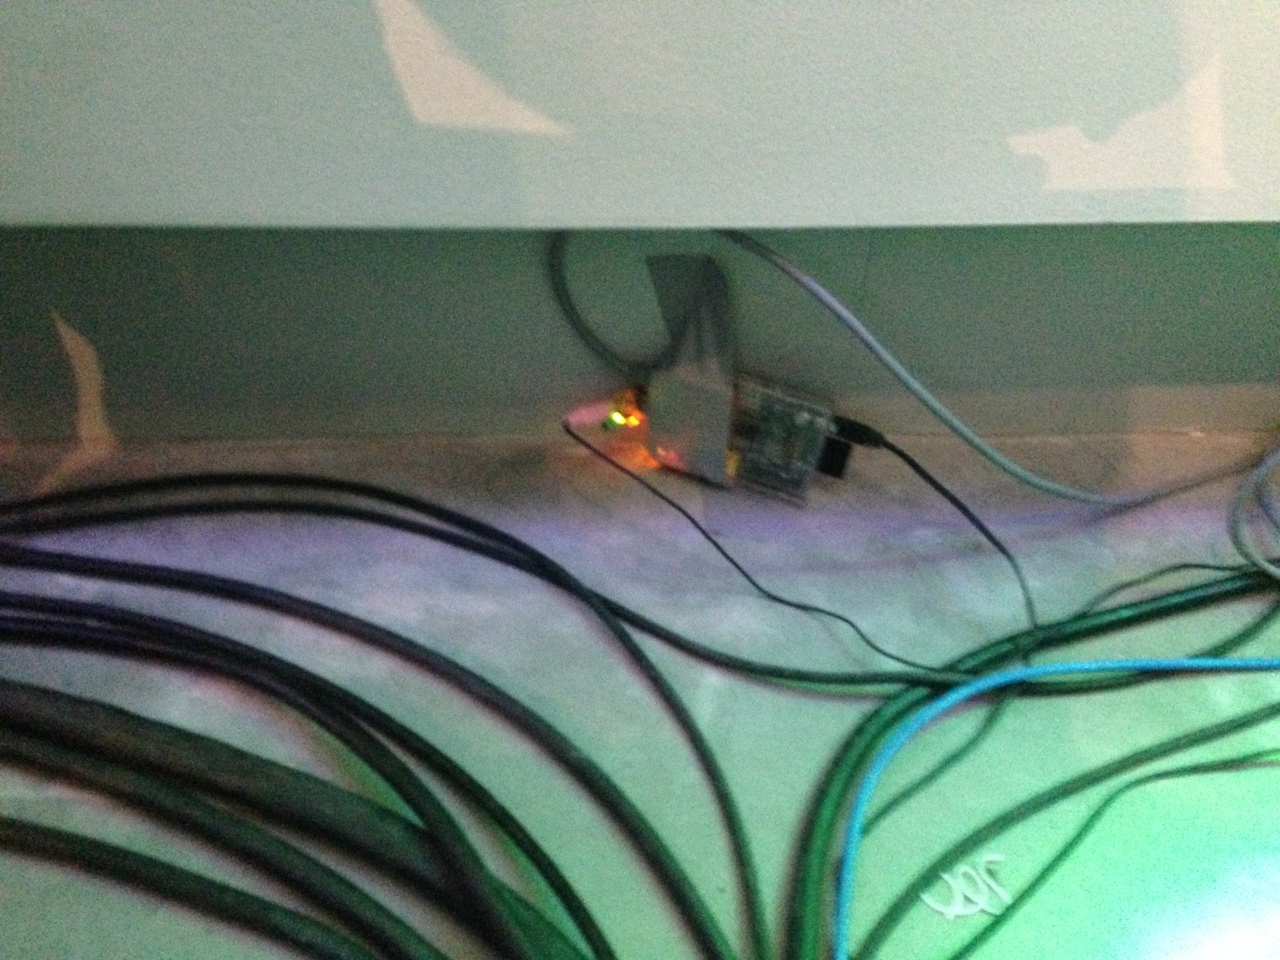
Raspberry Pi taped to the floorboards.
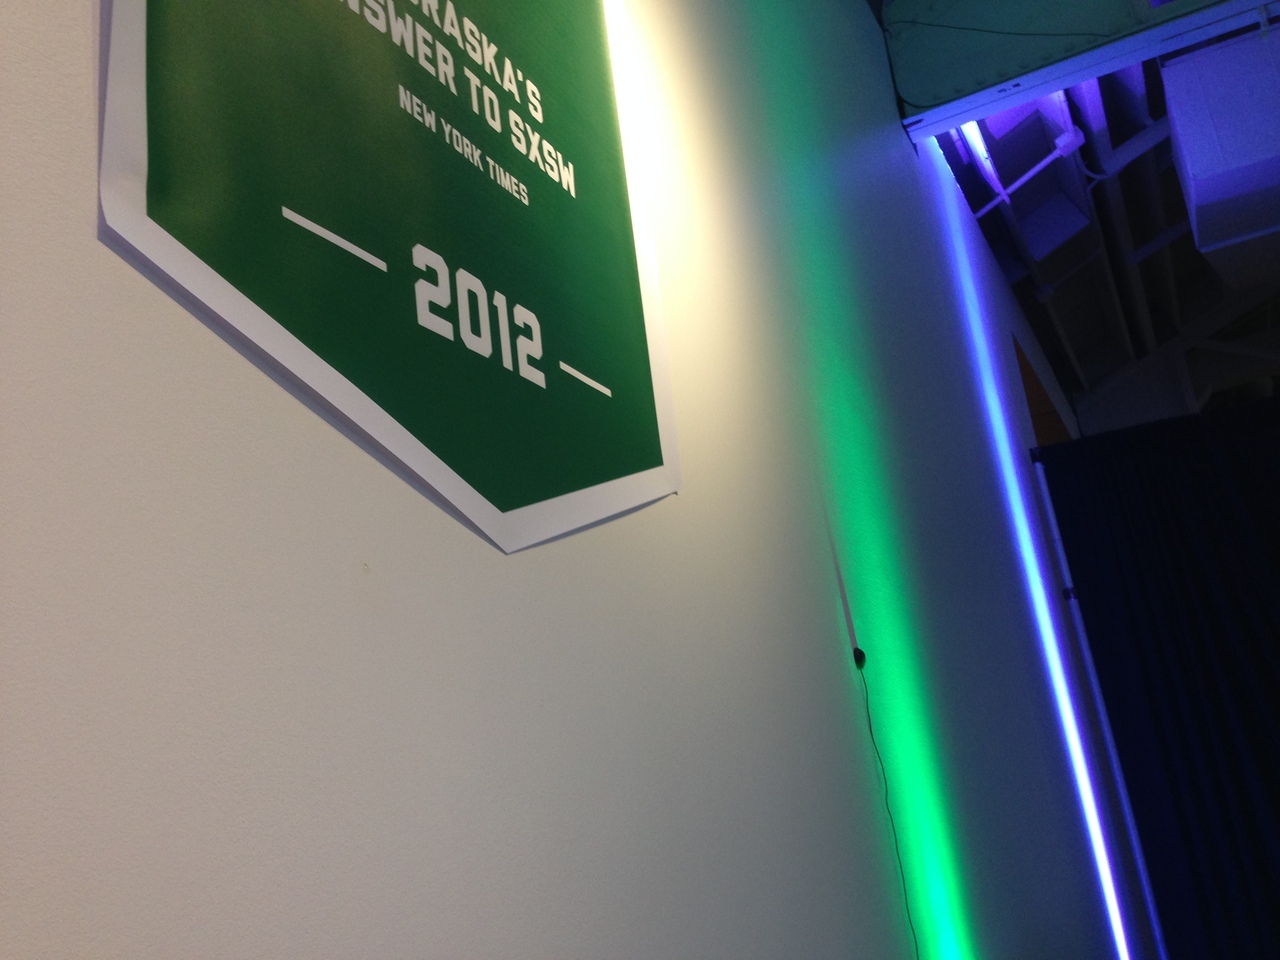
Our little mic on the wall.
Software
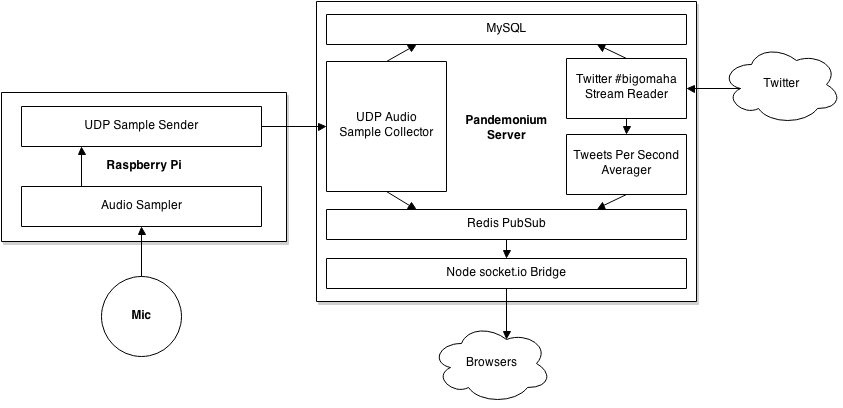
The architecture of Pandemonium is perhaps a bit over complex, but I was having fun gluing things together and who's gonna stop me?
Audio
Audio starts at the input, which we read with PyAudio. We read 10ms of audio, then calculate the RMS Amplitude of that data to produce our "loudness" value.
This packet gets pushed into a queue with a timestamp that is shared with the UDP client process. This process picks it up, and collects 50 other samples finding the peak value. Once it has collected 50 packets (0.5 seconds) it takes the peak value, wraps it with a signature and sends it off. The signature is an abbreviated HMAC to verify the origin and quality of the data. Originally we were sending 100% of the samples collected, so 100 per second. We decided that was a bit extreme and added the summarization code to reduce it to twice per second.
The UDP server receives the packet, unpacks it, and checks the signature. If it's valid, it stores it in MySQL (async) and also pushes it to a Redis pubsub channel.
From there a node.js server picks it off the Redis pubsub channel and sends it down through socket.io to waiting clients. Even with all these hops, the roundtrip is pretty snappy, and there is less than a second of obvious lag.
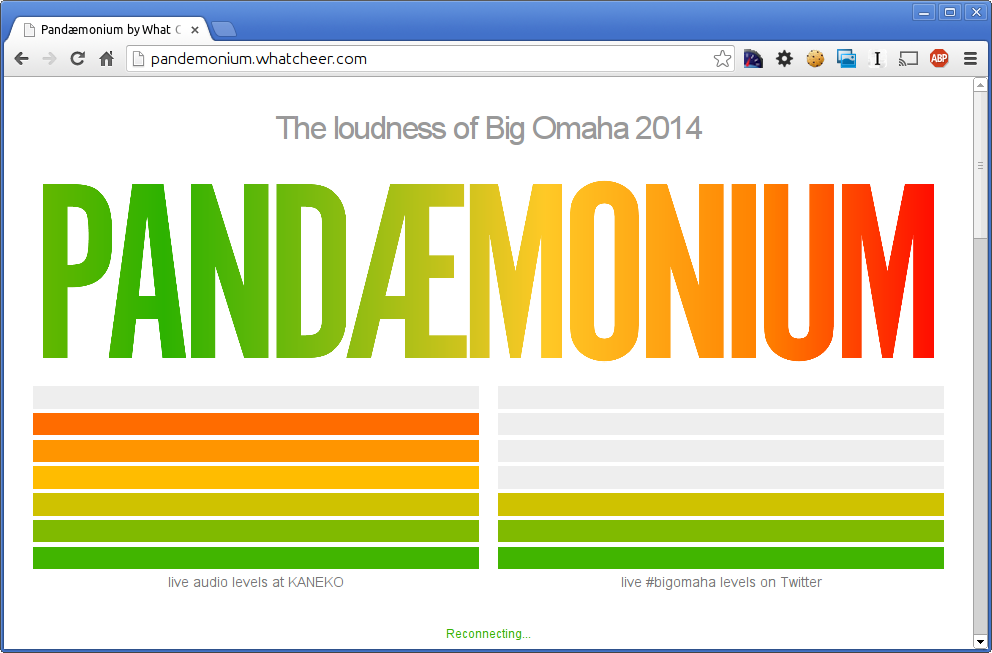
On the client side we had a digital VU-style meter which scaled the volume over it's seven bars and lit up accordingly. We also pushed the data to a live graph powered by HighCharts.
Tweets were collected for the hashtag #bigomaha and stored directly into MySQL by a daemon using the Twython library.
A second process would aggregate and average the tweets per second, then push that data to a Redis pubsub channel to be distributed by the node.js bridge.
Since there isn't a natural comparative value for Tweets, the aggregator keeps the peak value in memory and compares the current value against that for a percentage. Not perfect, but it's works.
Mistakes Were Made
Everything performed better than I expected, honestly. We didn't have the opportunity to test the audio sampling at a large, loud venue, so I was worried about that. Paul and I installed it in the back of the auditorium, just past a speaker, and put the mic as high up the wall as we could, which seemed to isolate it pretty well.
However, there were some problems. Due to a fat finger, none of the audio data from day one was saved until about 3pm. So that was a bummer. A quick fix gave us good data for day two through.
My second goof was that the MySQL library I used for storing tweets assumed that data was latin-1, even though I created my tables as utf-8. So, when people tweeted anything with odd characters, the database barfed and it dropped the tweets. That also got fixed in the afternoon on day one.
Success?
I think it was a neat project, I certainly had fun building it. And it worked, which is always what we are aiming for, and it didn't require any direct interaction from attendee's to succeed, it survived on it's own. I wish I hadn't made mistakes, but they weren't too damaging to the real-time experience at Big Omaha.

Day one data.